


User interfaces
Log in page
Forgotten password
By entering your registered email address here, you can request a temporary login link, which will be sent to you by email.
Registration
Registration requires an invitation, which can be requested via the form available on the registration page. In addition, depending on your project settings, you can register using Google or another OpenID-based provider.
Profile page
Settings related to our profile.
Invitations
By default, all registered users can invite additional members.
Messages
Internal messages are read and sent here. Our messaging system distinguishes between four message types:
A system message can be sent by a project or a server process to an individual user. Such a message could, for example, be from a background validation process.
A personal message can be sent between users. The message editing interface can be accessed by clicking the Write Message button at the bottom left of the Messages page.
Comment Notification - This message type is sent when someone has commented on your data, uploads, or users.
News - when uploading data, creating a new project, or sharing polygons, the system creates a news item for everyone to see.
The messages page is available to all logged-in users. Anyone can send messages to project members.
In addition to individual messages, project administrators can send messages to groups or notify users by email.
Creation of a new database
Any registered member can create a new database project, which he/she will own and will be completely independent of the project in which it was created.
Project administration
Project settings. For example, upload forms and map settings, or user administration.
Map page
If you have map data and valid settings (SQL, Mapserver), you can view and query the map data from this subpage. Some map settings may differ significantly, for example, only the queried data may be displayed. There may be different base maps, e.g., grids or aerial photos, and sampling locations on a map. You can display point, line, and polygon data (in separate layers). Several base maps can be selected (OSM is the default). In some projects, you can set up a Google base map if the project owners do so by entering some Google account data.
map queries
Spatial queries can be triggered by drawing on the map, tapping on the map (info module), or selecting pre-loaded geometries. When drawing a map, a buffer zone can be specified around the drawing pointer. That is, you can query a point by dropping a point in say a 500m radius circle, or around a line in a 10m zone.
text queries
Arbitrary text query options can be set up in each project to query data, which options can include several helper functions such as auto-text completion, list selection, date, time, date interval selection, multiple list item selection, etc…
query storage
The result of a query can be stored on the server and referenced by a persistent keyword. A DOI identifier can be requested for these identifiers. The query can also be stored and used to repeat it.
Data upload page
Any number of forms can be defined for a data table, allowing different data to be loaded with different options. For example, some forms may be designed for mobile-only formatting or public data upload, while others may be designed specifically for a particular file type to be imported. At any time during the upload process, you can save and download the upload status in CSV format.
File upload
Supported formats:
Plain text files: CSV, DSV, TSV, JSON
Image files: jpg, tiff (Exif columns are read out)
Spreadsheet formats: ods (LibreOffice), xls (Excel), xlsx (Excel)
Spatial formats: ESRI shape (.shp, .dbf, .cpg, .prj, .shx combined), GPX (GPS data format (XML)), SQLite
Genetic data files: fasta
Any of the files listed here can be imported by entering a URL (simple GET query)
Web form filling
Data can also be uploaded using a web form. You can add any number of rows to your table when uploading. Data upload can be accelerated using various bulk cell upload functions.
External applications
Use of API interface (e.g. mobile app, R-package)
Use SQL connection (e.g. QGIS)
Export data from the upload process
During the data upload process and from the saved state of interrupted uploads, the data can be exported to a CSV file.
Abort data upload
The data upload process can be interrupted at any time from the web interface. A backup is automatically created every 2 minutes, but you can create one at any time by clicking the Save button in the redundant menu bar.
Uploads that have been suspended can be restored by selecting them from the ‘Suspended Uploads’ list on the profile page.
Completed uploads are automatically deleted from the list.
Data upload history page
The metadata for each data upload is automatically recorded and can be accessed on the user’s profile page or in the datasheet.
Datasheet page
Each data record has its data sheet, which contains all the associated metadata and data fields for the record. Depending on the settings, the available data content can be restricted in various ways.
Data history page
Each data record has its data history sheet, where you can view the changes to the record. This feature only works if the project host has enabled data change records in the project settings.
Database summary page
Each database includes a summary page with a description and contact details.
Welcome page
Error reporting
The bug submission feature is available from the profile page and the upload page. Clicking the bug in the bottom-right corner of the screen will open the bug submission interface.

Bug in the bottom right corner
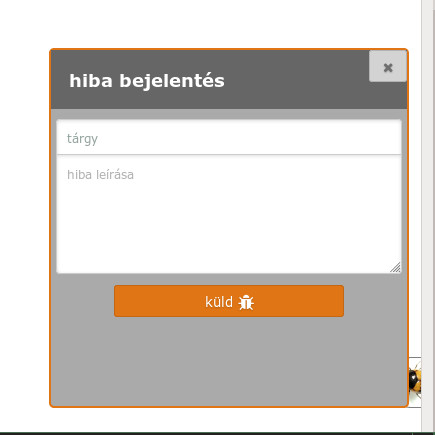
Simple messaging interface
The interface sends errors to the OpenBioMaps developer page (https://gitlab.com/groups/openbiomaps/-/issues), from which the user will automatically receive a system response for subsequent events.
The error handler can be made available on a server by specifying the AUTO_BUGREPORT_ADDRESS address in the system_vars.php.inc configuration file. More information about the GitLab Issue handler interface can be found here: https://docs.gitlab.com/ee/user/project/issues/